Grocery Spending Tracker — See exactly where your food money goes
If you can't see it, you can't fix it. Most households know roughly how much they spend on groceries each month — but ask which store costs more, which categories are creeping up, or which days you tend to overspend, and the answers stop. GroceryTracker Pro is a grocery spending tracker built around visibility: every scanned receipt becomes searchable, sortable, and chartable data, so the patterns hidden in your weekly shop become impossible to miss.
What you actually see in your spending dashboard
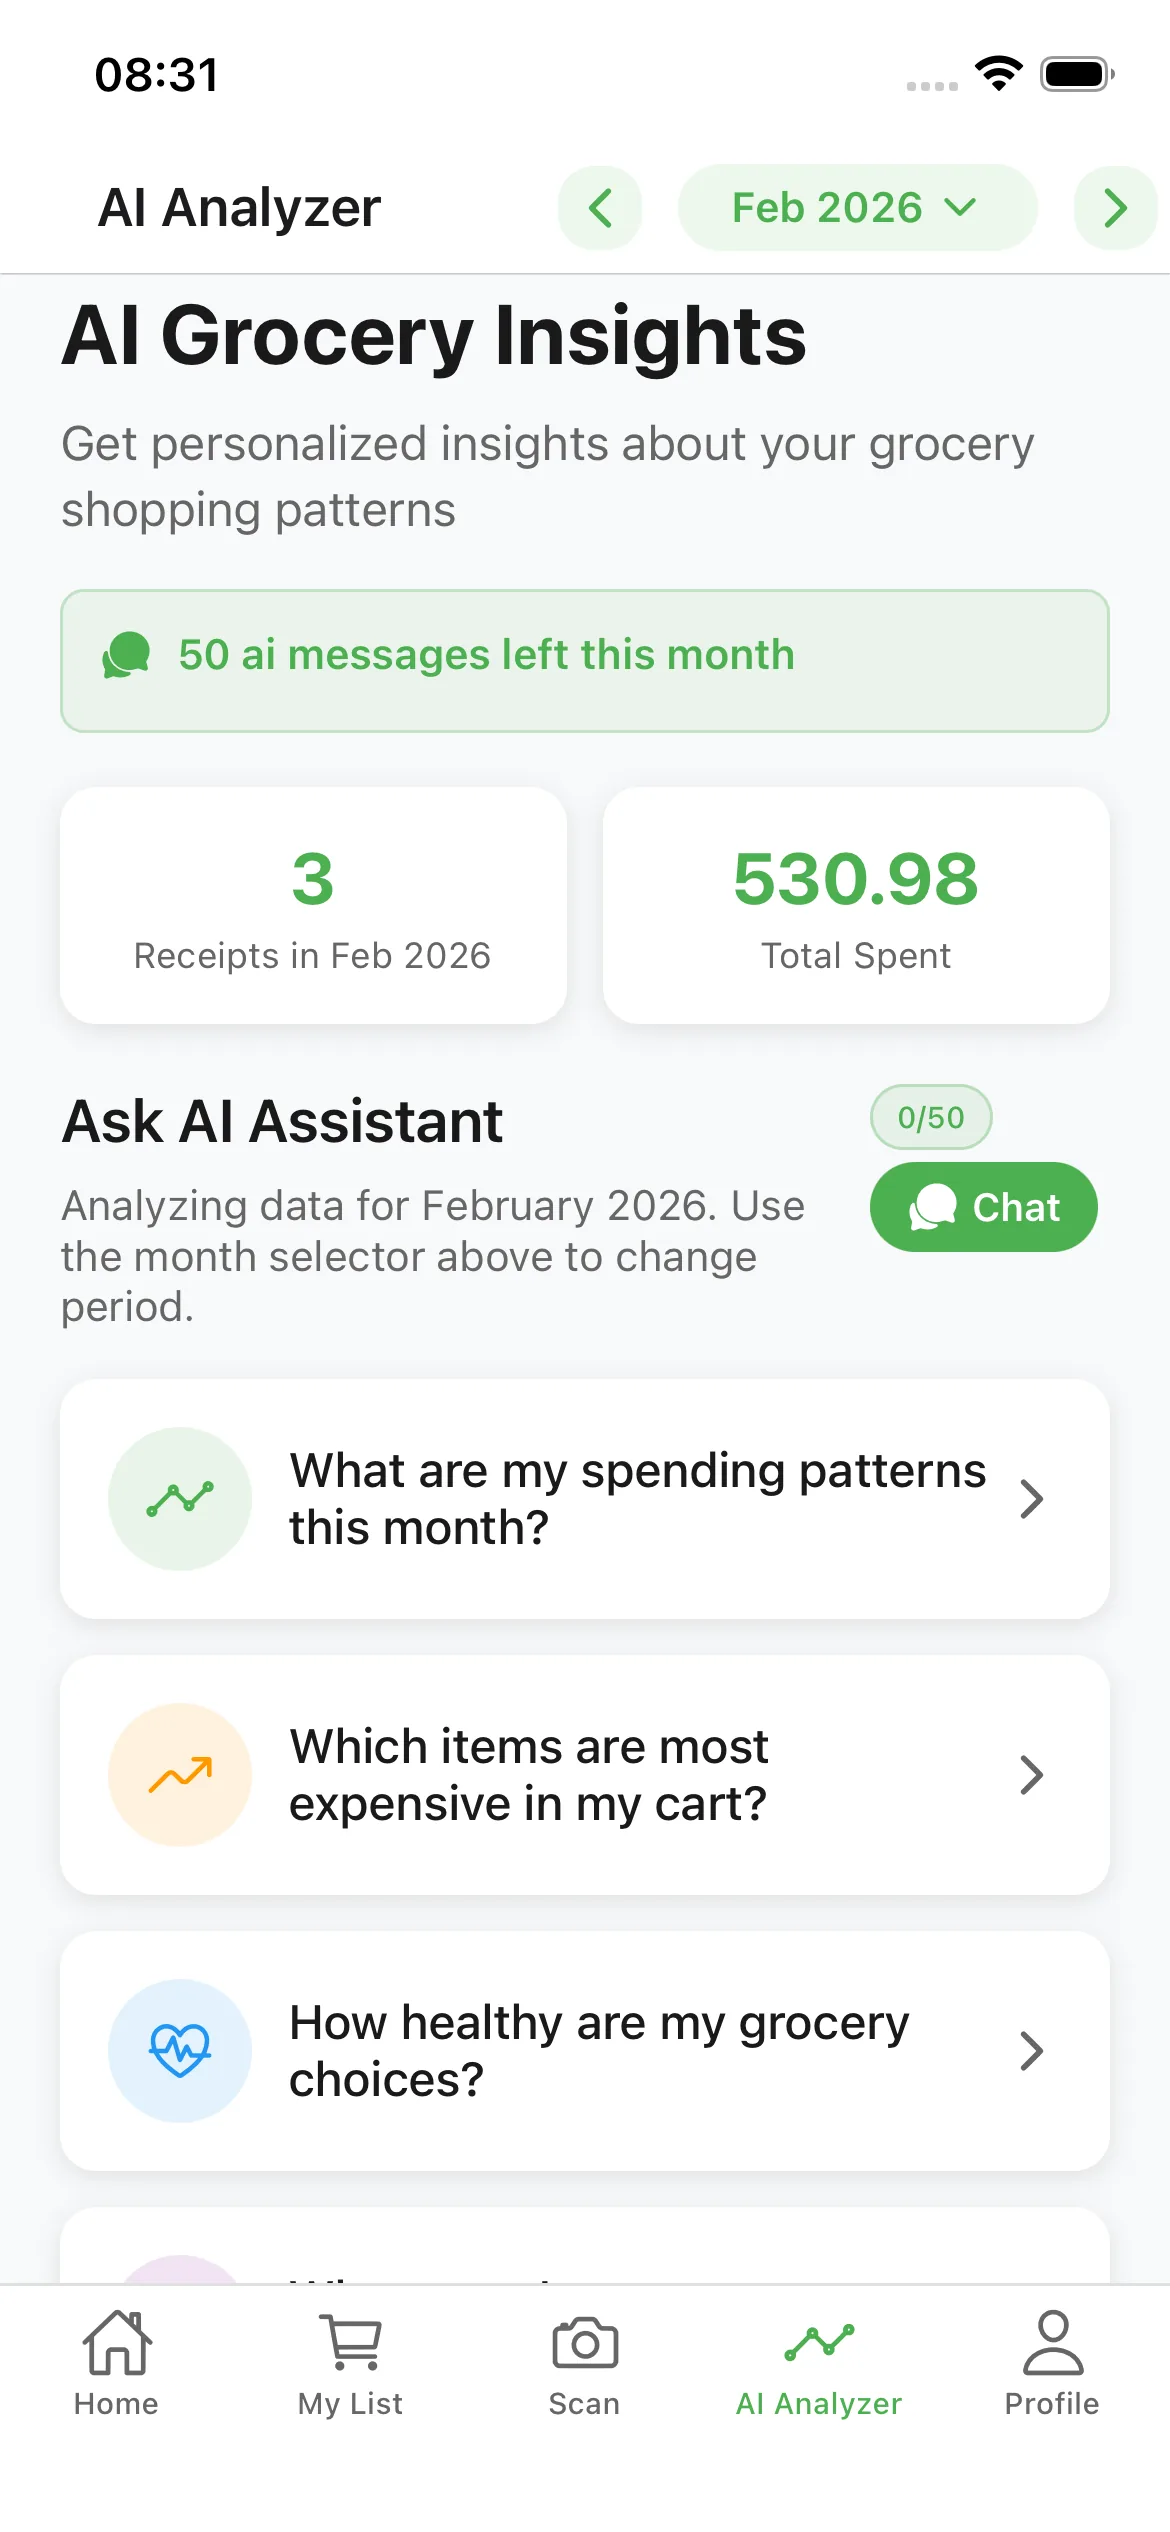
Open the app and the first thing you see is your spending this week, this month, and the same period last year. One tap drills into a store-by-store breakdown: how many trips, average basket size, total spent. Another tap shows category trends — produce, meat, snacks, beverages, household goods, alcohol — each with month-over-month deltas.
The most useful view for most households is the per-item price history. Tap any product (say, a 2-litre olive oil) and you see every time you bought it, at which store, and for what price — plotted as a line chart. Shrinkflation and quiet 30% price hikes become obvious. Fake "deals" (a sale price that's actually higher than last month's regular price) get caught the moment you scan.
How real-time visibility changes spending behavior
Behavioral economists call it the observation effect: simply being aware of spending tends to reduce it by 5–10%, even with no other changes. A grocery spending tracker compounds that effect because every scan is a tiny reflection point. You don't need willpower or guilt — you just need the data in front of you at the moment of decision.
Users who scan every receipt for two months typically identify three or four predictable spending leaks they didn't know existed. Common examples: snack purchases on Friday afternoon trips, generic-brand items they assumed were cheaper but weren't, and produce that was bought in volume but thrown out by midweek. The fix isn't a diet or a stricter budget — it's information.
Visibility features that turn receipts into insight
- Per-item price history — Tap any product to see every purchase, store, date, and price as a chart.
- Store comparison view — Side-by-side totals for the same shopping list across Walmart, Costco, Aldi, Lidl, Kroger, and more.
- Category trend lines — Six-month rolling charts for produce, meat, snacks, beverages, and household items.
- Day-of-week analysis — Discover which shopping days produce the highest basket totals — usually Friday and Sunday.
- Search by item or store — Find every time you bought a specific product, across every store, in seconds.
- Year-over-year comparison — See how grocery inflation has affected your real spending versus the same month last year.
Why bank app categories aren't enough
Banking apps that auto-categorize transactions can tell you that you spent $612 at grocery stores last month. They can't tell you that $94 of that was alcohol, $61 was household cleaning supplies, and $38 was an impulse purchase you don't even remember making. They also can't tell you that the same brand of yogurt costs 22% more at Whole Foods than at Aldi.
That granularity — the difference between a category total and a line-item-level view — is where the savings actually live. A grocery spending tracker reads every line item from every receipt, so what shows up in your dashboard is the real picture of your food spending, not just the total at the till.
Frequently Asked Questions
What can I see in a grocery spending tracker that I can't see in my bank app?
Bank apps show category totals ("$612 in groceries"). A grocery spending tracker shows every line item: which products, at which prices, at which stores, on which days — plus per-item price history so you spot shrinkflation and fake deals.
How long until I see useful patterns in my spending?
Most users identify their first predictable spending leak within two weeks. Meaningful trend lines (category changes, store comparisons, year-over-year shifts) become reliable around the 60-day mark.
Does the app track cash purchases?
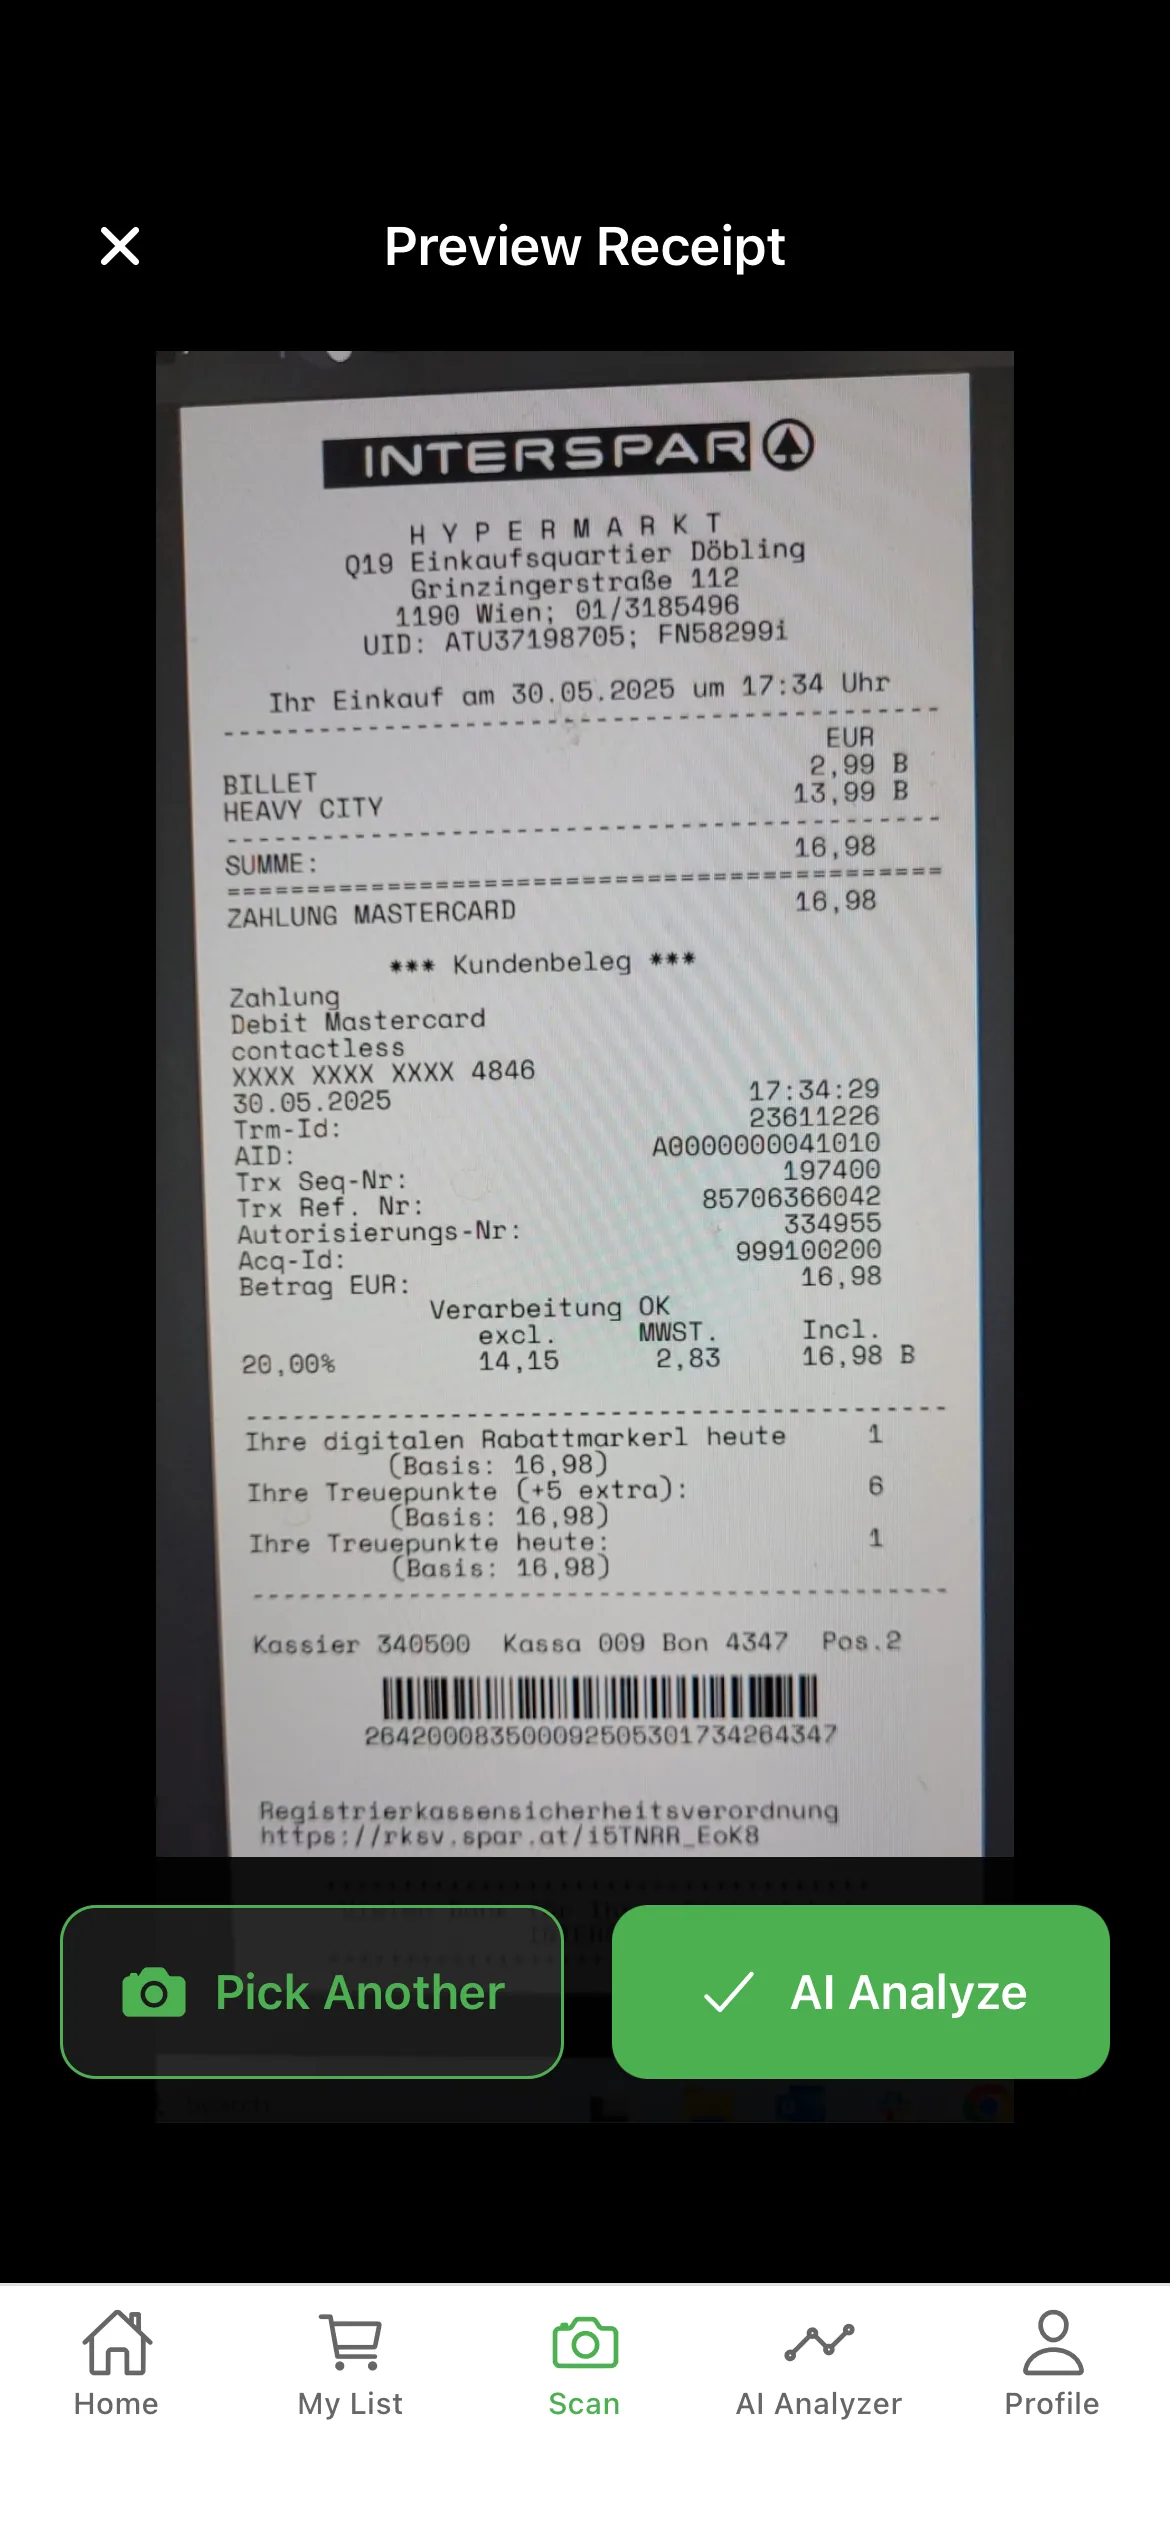
Yes. Scanning a paper receipt captures the data regardless of how you paid — cash, debit, credit, gift card, or split tender. That's a gap most bank-app trackers can't close.
Can I export my spending data?
Yes. Premium plans include CSV and PDF exports of your full spending history, broken down by store, category, or date range — useful for personal records or sharing with a financial advisor.
How is per-item price history calculated?
Every receipt you scan adds a data point. Once you've bought the same product more than once, the app charts the price over time at each store you bought it from. Most users have meaningful price history on their core items within 30–45 days.
Start tracking your grocery spending
Free on iOS & Android — no signup required to start scanning.